Spatial Data Integration: Disclosing 202 Unregistered High-Risk Segments

Background
Taipei's disaster response decision-making has long been constrained by a "data gap": the 1,470 narrow alleys registered in urban planning records and the 274 entries in the fire department's field survey have never been cross-referenced.
The fire department currently publishes two related inventories, last updated in May and October 2024 respectively—neither on a regular annual cycle. The only existing visualization is a citizen-made Google My Maps from 2014, with data frozen since 2016. For a decade, the city has lacked any tool to answer: where are the narrow alleys, how high is the risk, and does the planning reflect reality?
· Market Pain Point: Existing tools cannot quantify the gap between planning records and fire department practice, leaving disaster resource allocation without a precise basis.
· Core Thesis: Urban planning geodata should not be a static document—it should be a verifiable spatial hypothesis.
· Technical Goal: Validate the feasibility of a Laravel + PostGIS architecture in Taiwan's public-sector GIS environment, and test the integration viability of migrating from Google Maps commercial APIs to an open-source map infrastructure based on GeoServer.
Challenges
- Data Reality and the Cascading Problem of Missing Geometry
The original plan was to compare planned road widths against field-measured widths. However, Taipei's publicly available field measurement data only covers segments wider than 8 meters and is in Polygon format—field-measured line segments for narrow alleys simply do not exist in public channels. The fire department's 274 entries include field-measured widths, but only as Chinese-language addresses with no coordinates or line geometry. Without source geometry, spatial comparison of length, density, and positional reliability cannot be established. - Semantic Gap in Spatial Definitions Across Regulatory Domains
• Conflicting Definitions
Urban planning thresholds are set by building codes <3.5m, while fire safety records are based on operational realities <4m "Red Zones".
• Data Integrity
As standards for "narrow alleys" differ across agencies, the challenge lies in representing these discrepancies authentically without forcing a unified value, thereby avoiding data distortion. - Boundary Definition and Trade-offs in Independent Research
Without a specification document, I had to independently prioritize features across technical depth, social value, and development cost. Any imbalance risked drifting the system away from its core purpose as a decision-support tool.
Actions
- Spatial Reconstruction Strategy
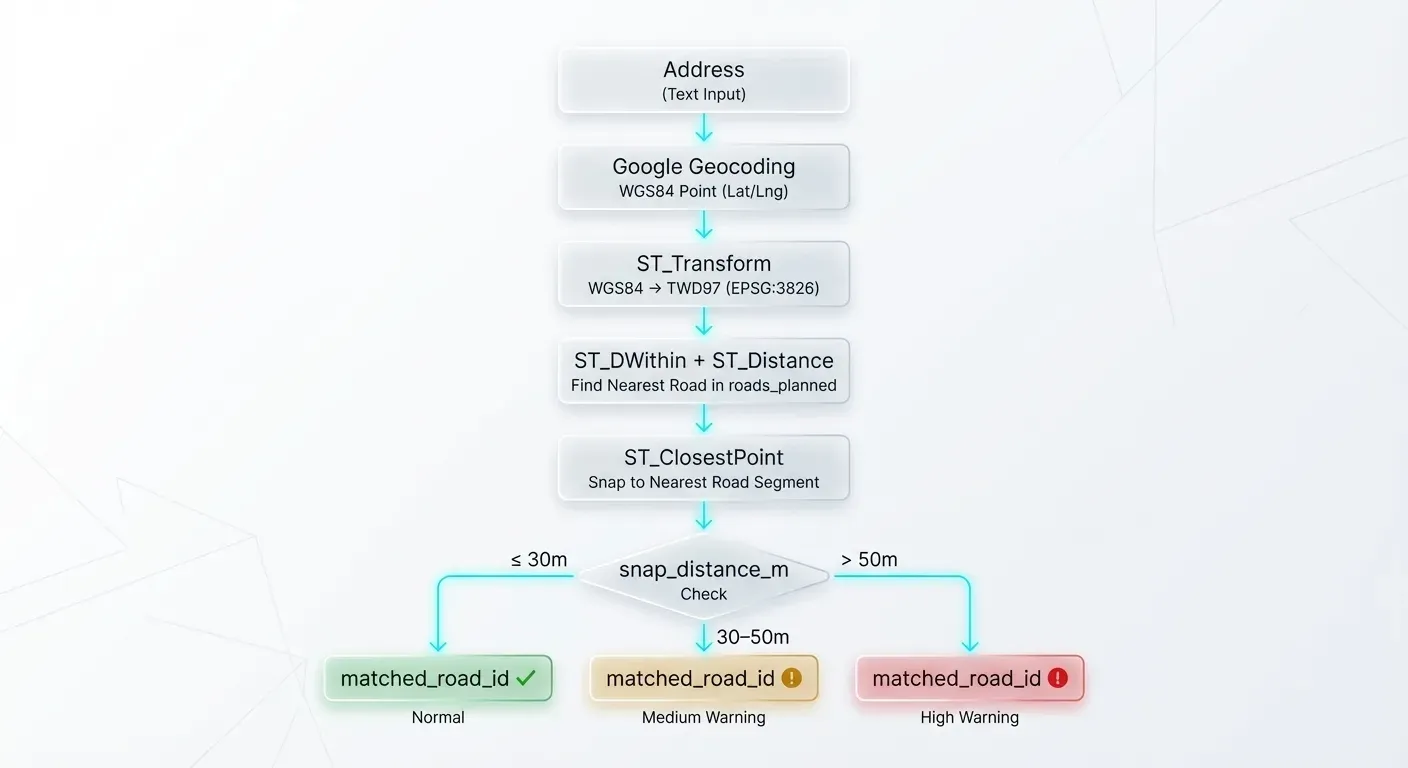
To address missing geometry in the inventory, I built a proxy mechanism of "borrowing existing geometry and annotating credibility boundaries." The automated snapping pipeline runs only once at data import: Geocoding to point → TWD97 projection → ST_ClosestPoint snapping to planned road segments—ensuring the live system does not depend on external services. - Coexistence Rendering Strategy
Instead of forcing a unified logic, the system utilizes "dual-rendering" on the same segment to present both planned and measured values simultaneously. Risk levels strictly adhere to statutory codes, while fire records are displayed in their original classifications without secondary interpretation—the transparency of this "Architectural Honesty" serves as the core foundation of the system’s credibility. - Layered Architecture Constraint
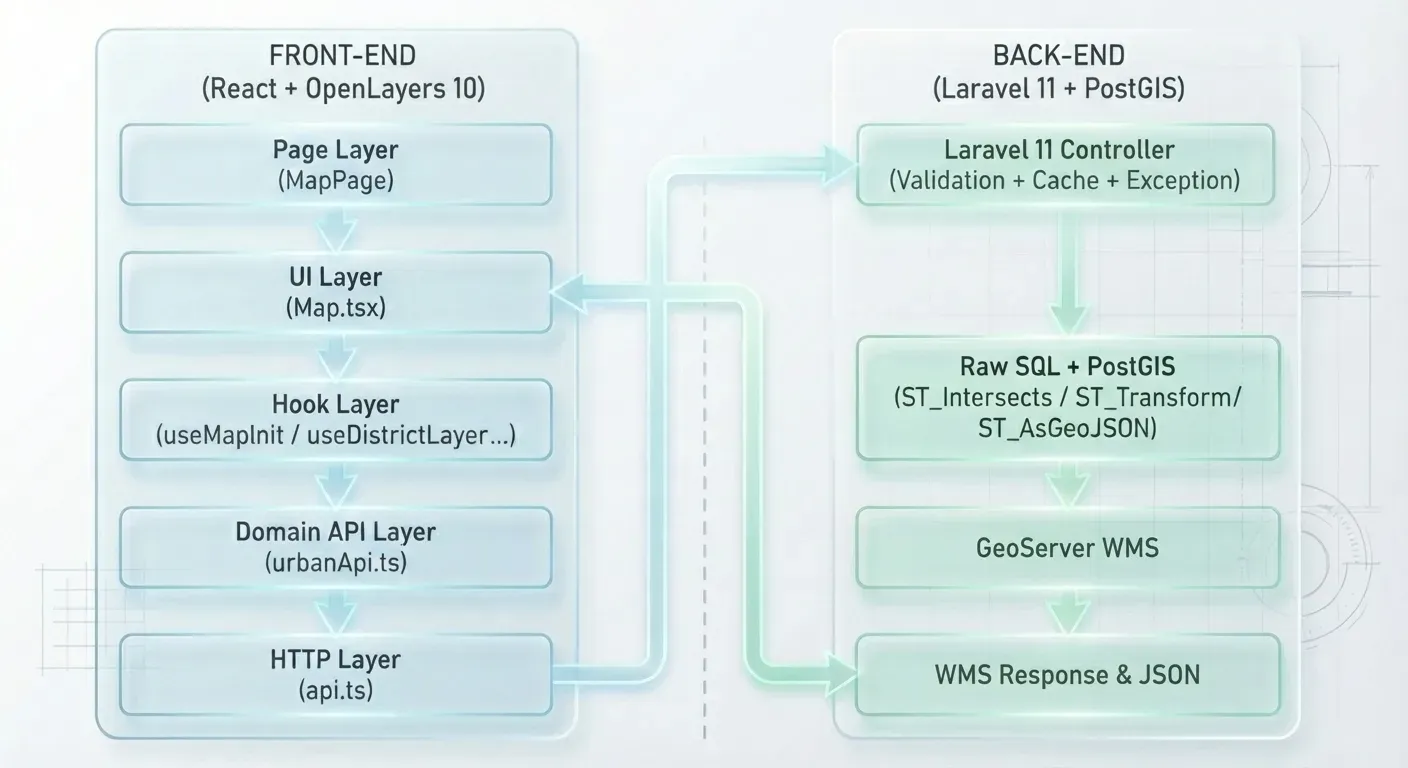
• Backend (Laravel + PostGIS): Encapsulated core business logic and spatial computations to ensure data integrity.
• Geospatial Engine (GeoServer): Executes server-side rendering with SLD styling to handle large-scale static geometries with no interaction requirements.
• Frontend (React + OpenLayers): Manages client-side VectorLayer rendering for interactive elements and application state, utilizing OpenLayers to orchestrate multi-source WMS and Vector layers.
Execution
- Case A|Data Transformation: From Heterogeneous Addresses to Spatial Risk
Facing 274 fire department entries with only text descriptions, I had to reconstruct spatial relationships without source geometry. Despite complete inventory structure, the address semantics were highly heterogeneous.
1. Technical Breakthrough
Validated Google Geocoding's ability to parse ambiguous semantics, and implemented an automated pipeline: Geocoding → TWD97 Projection → ST_ClosestPoint Spatial Snapping.
2. Making Uncertainty Explicit
Rather than filtering out uncertain data, the system explicitly annotates "distance offset" and "width offset" warnings in popups (e.g., ❗ High Offset), turning technical limitations into credibility boundaries that decision-makers can evaluate.
3. Data Discovery and Output
By deduplicating viamatched_road_id, successfully identified 202 risk segments that the fire department had field-surveyed but urban planning had never registered—completing Taipei's first integrated narrow-alley spatial profile.
- Case B|Decision-Oriented Dashboard and Risk Classification
The initial system used a composite "narrow alleys × fire hydrant density" model with dynamic circles, producing three problems: the hydrant threshold lacked statistical basis, the composite metric was unintuitive, and map visual noise was too high.
1. Model Simplification and Noise Reduction
Decisively distilled the metric to a single "narrow alley density (count/km²)." This eliminated derivation errors and ensured the target audience could identify high-risk areas at a glance.
2. Statistical Anchoring
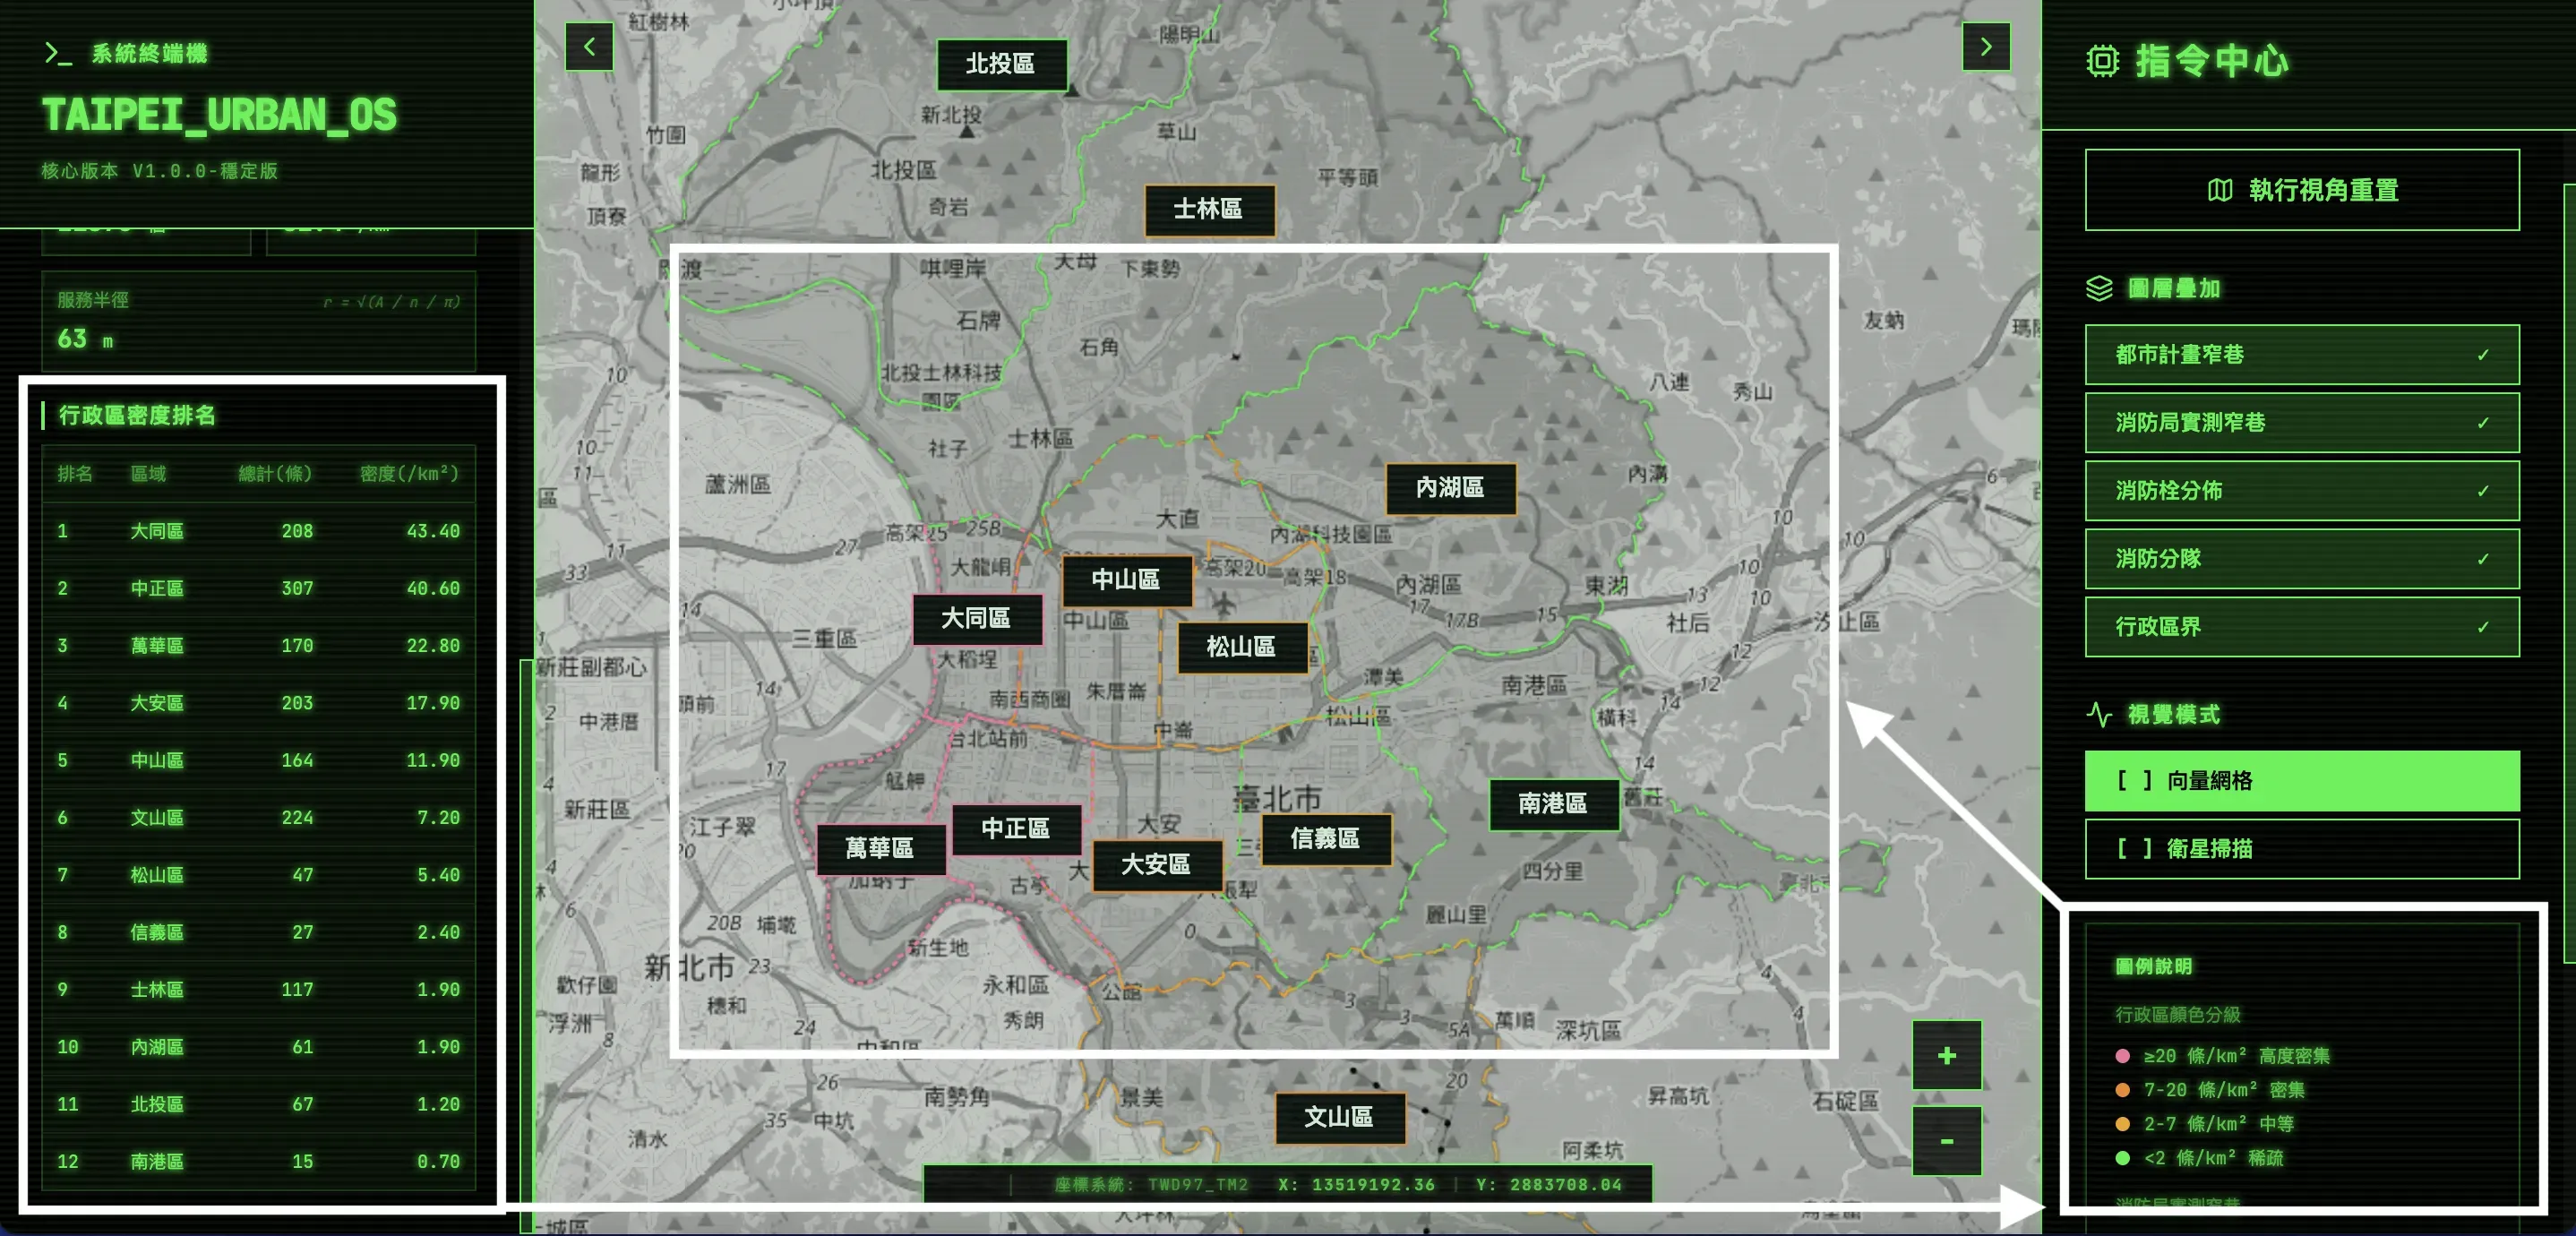
Moving away from subjective thresholds, the system utilizes quartiles calculated from real-world data across Taipei’s 12 districts (Q1: 2 / Q2: 7 / Q3: 20) as risk benchmarks. This ensures that the extreme-risk classifications for Datong (43.4) and Zhongzheng (40.6) are grounded in rigorous statistical evidence, bypassing subjective visual cognitive biases.
3. Scenario-Driven Information Architecture
Abandoned a separate dashboard page and integrated statistics into the left-side panel of the map. For planning meeting scenarios, this ensures "map distribution + statistical context" are simultaneously visible, avoiding cognitive interruption from cross-page navigation.
Outcomes
- Data Contribution: Identified 202 unregistered high-risk segments, addressing critical gaps in official planning. Established Taipei’s first integrated narrow-alley dataset, mapping a total of 1,672 segments and 9.18 km of previously undocumented spatial risks.
- Technical Validation: Technical Validation: Confirmed the reliability of a full-stack Laravel + PostGIS + OpenLayers architecture within public sector environments. Demonstrated that self-hosted GeoServer/OSM with SLD styling can fully replace commercial APIs, achieving 100% technical autonomy and long-term cost reduction.
- Methodology: Established a transferable risk assessment process that derives quantitative thresholds from regulatory text combined with quartile-based statistical anchoring.
Data Category Count Decision Value Urban Plan Alleys (plan only) 1,398 Statutory risk zones pending field verification Fire Dept. Field-Surveyed New Entries (field only) 202 Reveals real gaps not yet reflected in planning data Dual-Confirmed (high-risk overlap) 72 Priority hotspots for budget allocation Total 1,672 Complete spatial profile of narrow alleys across Taipei
Reflections
- The Ultimate Practice of Role Integration
This was the first project where I connected PM problem definition, UX sensibility, Technical Architect design, and full-stack Engineering—all with the same pair of hands. Role integration was not always smooth: early on I wrote business logic (risk judgment) in the frontend, until I realized that scattering judgment logic across the visual layer made the system unmaintainable. This process taught me that architectural layering is not just a technical convention—it's the means of ensuring product goals and implementation stay aligned over time. - The Semantic Turn in Data Governance
I realized that data integration is not a technical problem but a semantic and governance problem. The right architectural decision is not to eliminate uncertainty, but through architectural honesty—using warning mechanisms to surface data credibility boundaries—to ensure the system maintains transparent and reliable decision value even when data is imperfect. - Establishing Professional Identity
Experiencing diverse roles across these projects has crystallized my professional identity: I am not an engineer accumulating depth in a single vertical domain. Instead, I am a system builder capable of defining problems, designing architectures, and executing full-stack implementations. This is not just a role expansion—it is the first time these three core competencies have been integrated into a single, unified state of delivery within highly uncertain environments.
Performance Diagnostics: Cross-Layer Optimization of Web DRM Reader
Identified performance bottlenecks through cross-layer diagnostics and A/B testing, successfully optimizing PDF load times from 6.59s to 0.6s—a 91% increase in efficiency.
Smart City Governance: PFI Digital Transformation in Taoyuan
Unified four legacy systems into a single platform through governance design and role-based access control, serving six user types and managing 162,000 smart streetlights across Taoyuan.